
Home · Help · Web radio statistics
Web radio statistics: listeners, origin and peak times
For every web radio the customer portal shows how many people are listening, where they come from and when it is busiest. Everything is on the station page under „Webradio“ (web radio).
Status per program
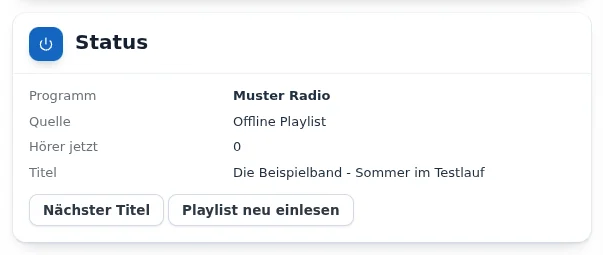
The „Status“ card shows per program whether you are live („Auf Sendung“, on air), the Offline Playlist is playing („Playlistsendung“) or the station is ready („Bereit“). It also shows the listener count, the source and the current track. The page refreshes every 10 seconds. If the server rejects a source, for example because of a wrong format, the reason appears under „Zuletzt abgelehnt“ (last rejected).
Listener origin
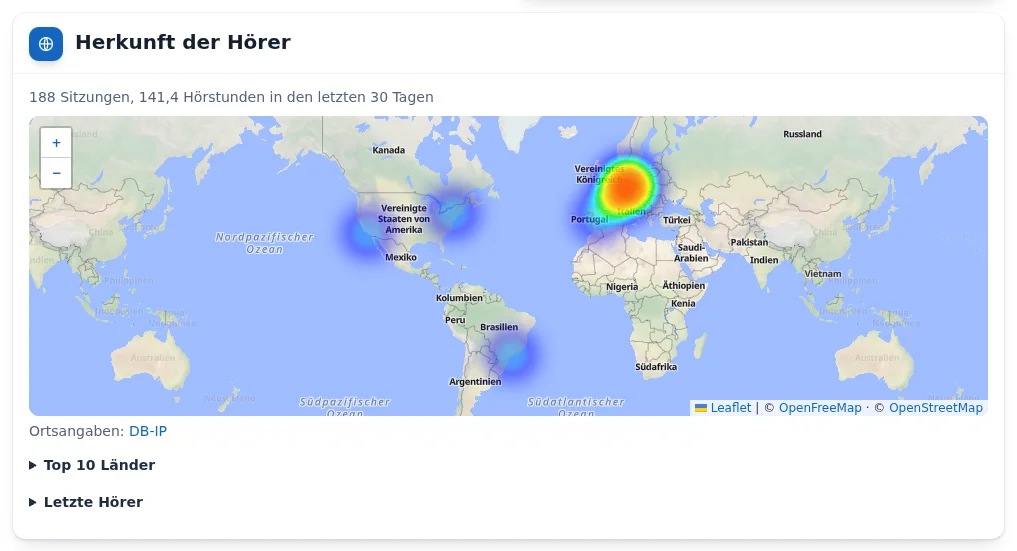
The „Herkunft der Hörer“ (listener origin) card summarizes the last 30 days: number of sessions, listening hours and a heatmap of the places people listened from. The map zooms to the area where listeners are, from a single city to several continents. A connection appears as soon as it has ended. Requests under 5 seconds do not count as listeners.
| Part of the card | Content |
|---|---|
| Heatmap | Listener locations, the denser, the more sessions |
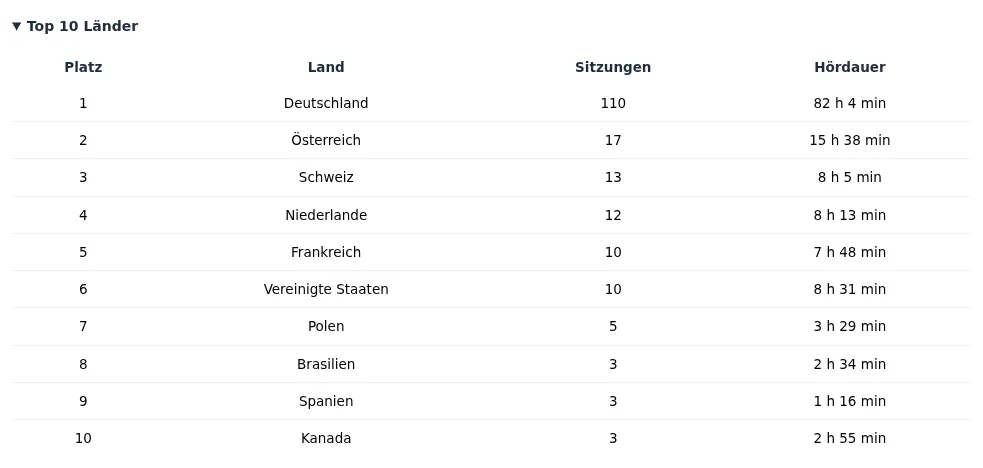
| Top 10 countries | Rank, country, sessions and listening time |
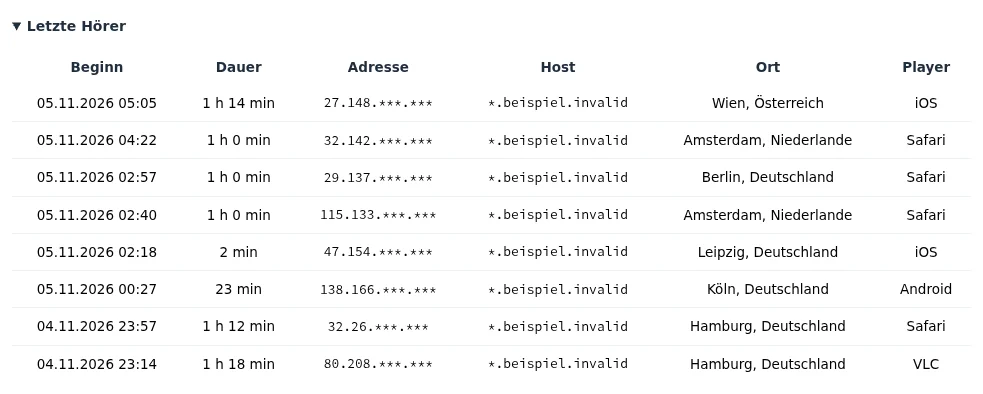
| Latest listeners | Start, duration, address, host, city and player |
IP address and hostname of listeners are shown shortened only, for example 91.64.***.***. Locations come from the DB-IP database and are approximate at city level. Entries are deleted after 90 days.
Statistics and peak times
- Last 7 days: history of the listener count.
- Listeners per hour of day (last 31 days): average and peak per hour. It shows at what time a live show reaches the most listeners.
- Data volume per month: volume used compared with the plan. An email is sent at 80, 100 and 120 percent.
Played tracks
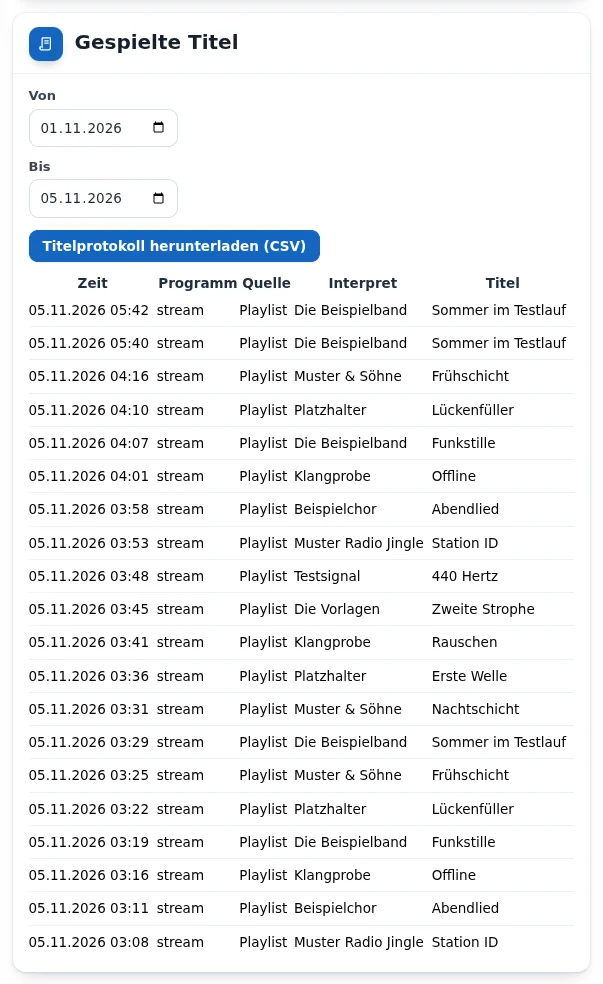
The „Gespielte Titel“ (played tracks) card lists every track change with date, time, program, source, artist and title, live and from the playlist. The list is available as a CSV download and serves as the basis for reporting to GEMA and GVL. It also shows whether the broadcasting software sends track titles.
Recordings
With Webradio 200 recording can be switched on per program. Every live show is then saved as a separate file with start, length and size and kept for 90 days. A recording can be downloaded or moved into the playlist.
Frequently asked questions
- Why does the map show a listener only later?
- City and duration are only known once the connection ends. The current listener count on the „Status“ card, however, counts immediately.
- Do playlist listeners count?
- Yes. Listeners of the live show, the Offline Playlist and the mobile address count together.
- Is listener data protected?
- The customer portal only shows shortened addresses, a full IP address is not visible there. Entries are deleted after 90 days.
See also: View Webradio plans Setting up web radio